
UX to UI
Quite controversial putting these 2 next to each otherNever fear, have a look at the below case study where I outline my process
Our vision:
Never breakdown
Never overpay
ABOUT THE PROJECT
HEADING ON is a Startup looking to revolutionise the way in which we maintain our vehicles and democratise our data.
Their main goals are to help drivers:
- reduce their chances of having a vehicle breakdown by observing the vehicle and the driving style
- provide an up to date mechanical status of your vehicle
- reduce unexpected and overpriced repairs by comparing maintenance and repair costs
All of the above is achieved through applying Machine Learning and Data Analytics on the collected driver and vehicle data in this problem domain.
My involvement in this project was to work with the HEADING ON Team to develop the user experience and design of the initial V1 Client App for the HEADING ON Service.
The process I followed was as follows:
- Assist in User Research and Analysis of user and vehicle data
- Interpretation of these results and creation of user persona’s
- create App Structure and Basic User Flow
- Sketching and Wireframing of initial ideas
- Final High Fidelity Designs for the Client App
TOOLS & TECHNOLOGIES USED
RESEARCH & ANALYSIS
In order to find the best approach, HEADING ON did a series of face to face interviews with potential customers and additional market research to determine the response to the proposed service as well as to gather as much information regarding user driving habits, needs and requirements.
HEADING ON also launched 2 Proof of Concept (PoC) rounds with 2 groups of test drivers, collecting actual vehicle data initially from 7, and then from 15 cars.
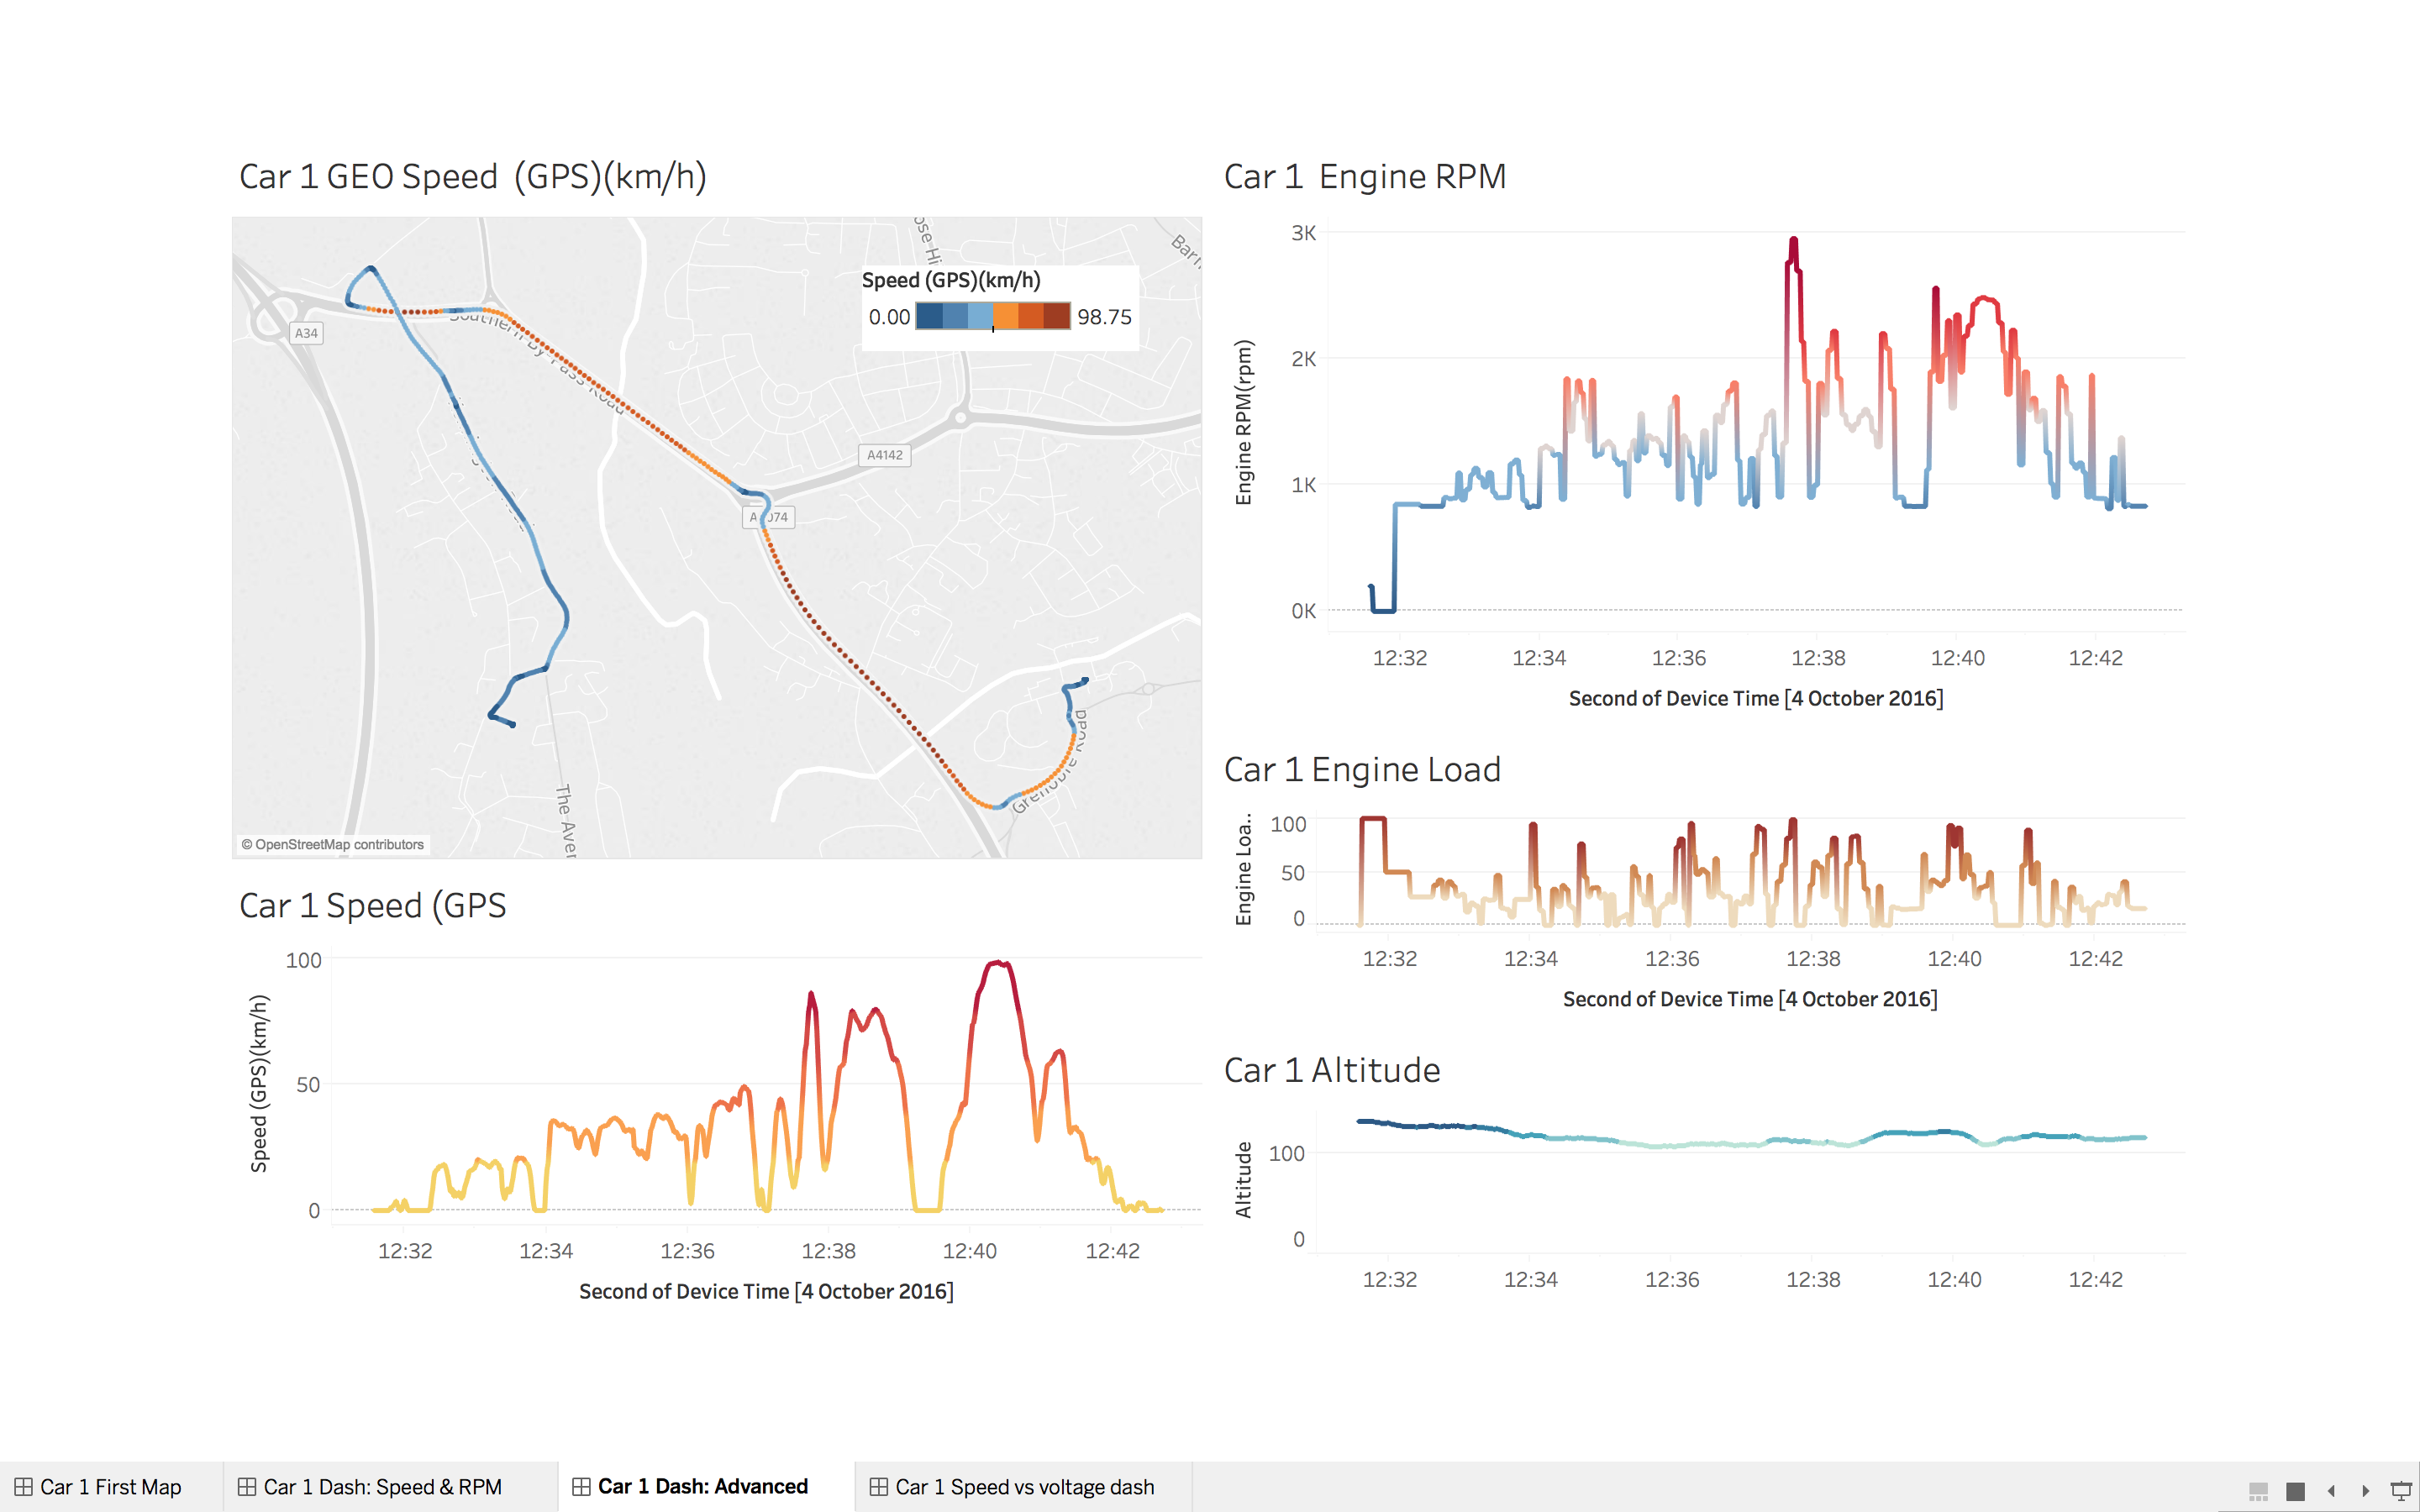
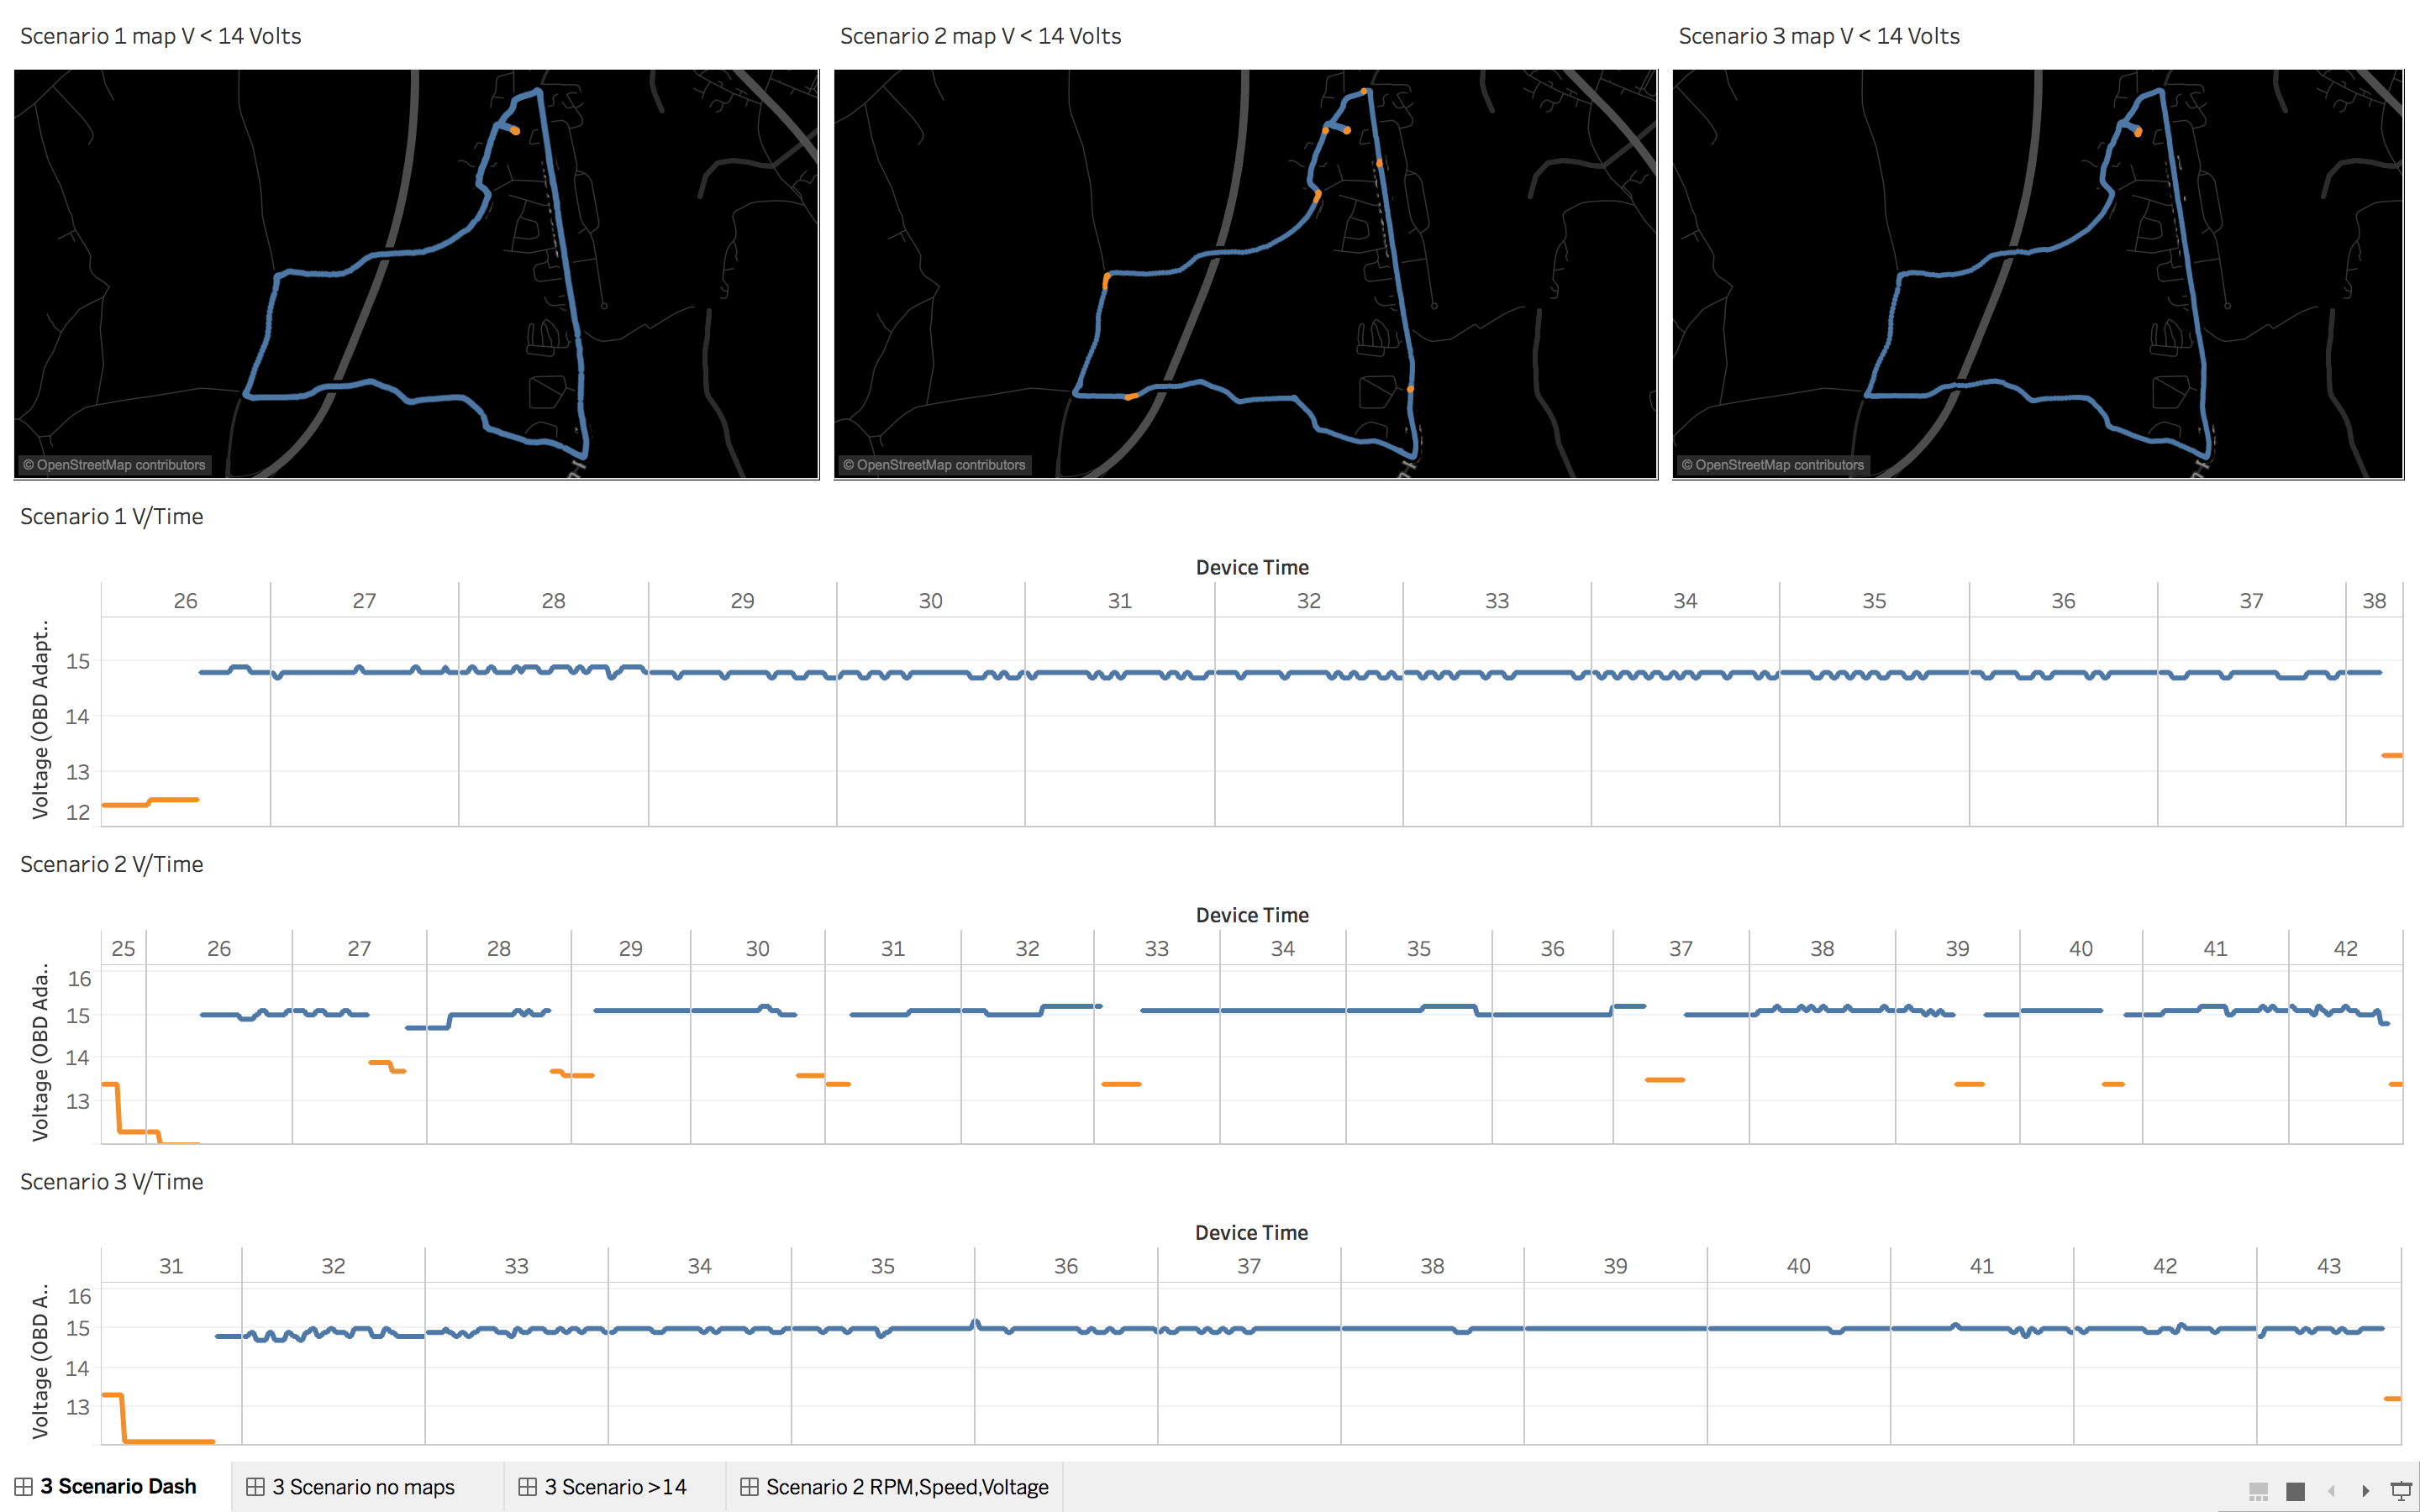
My involvement in this project initially started in order to do exploratory data Analysis and Visualisation using Tableau on this test data and to test the initial hypothesis and ideas. Feel free to have a look at some of the initial Exploratory Data Analysis and Visualisation.
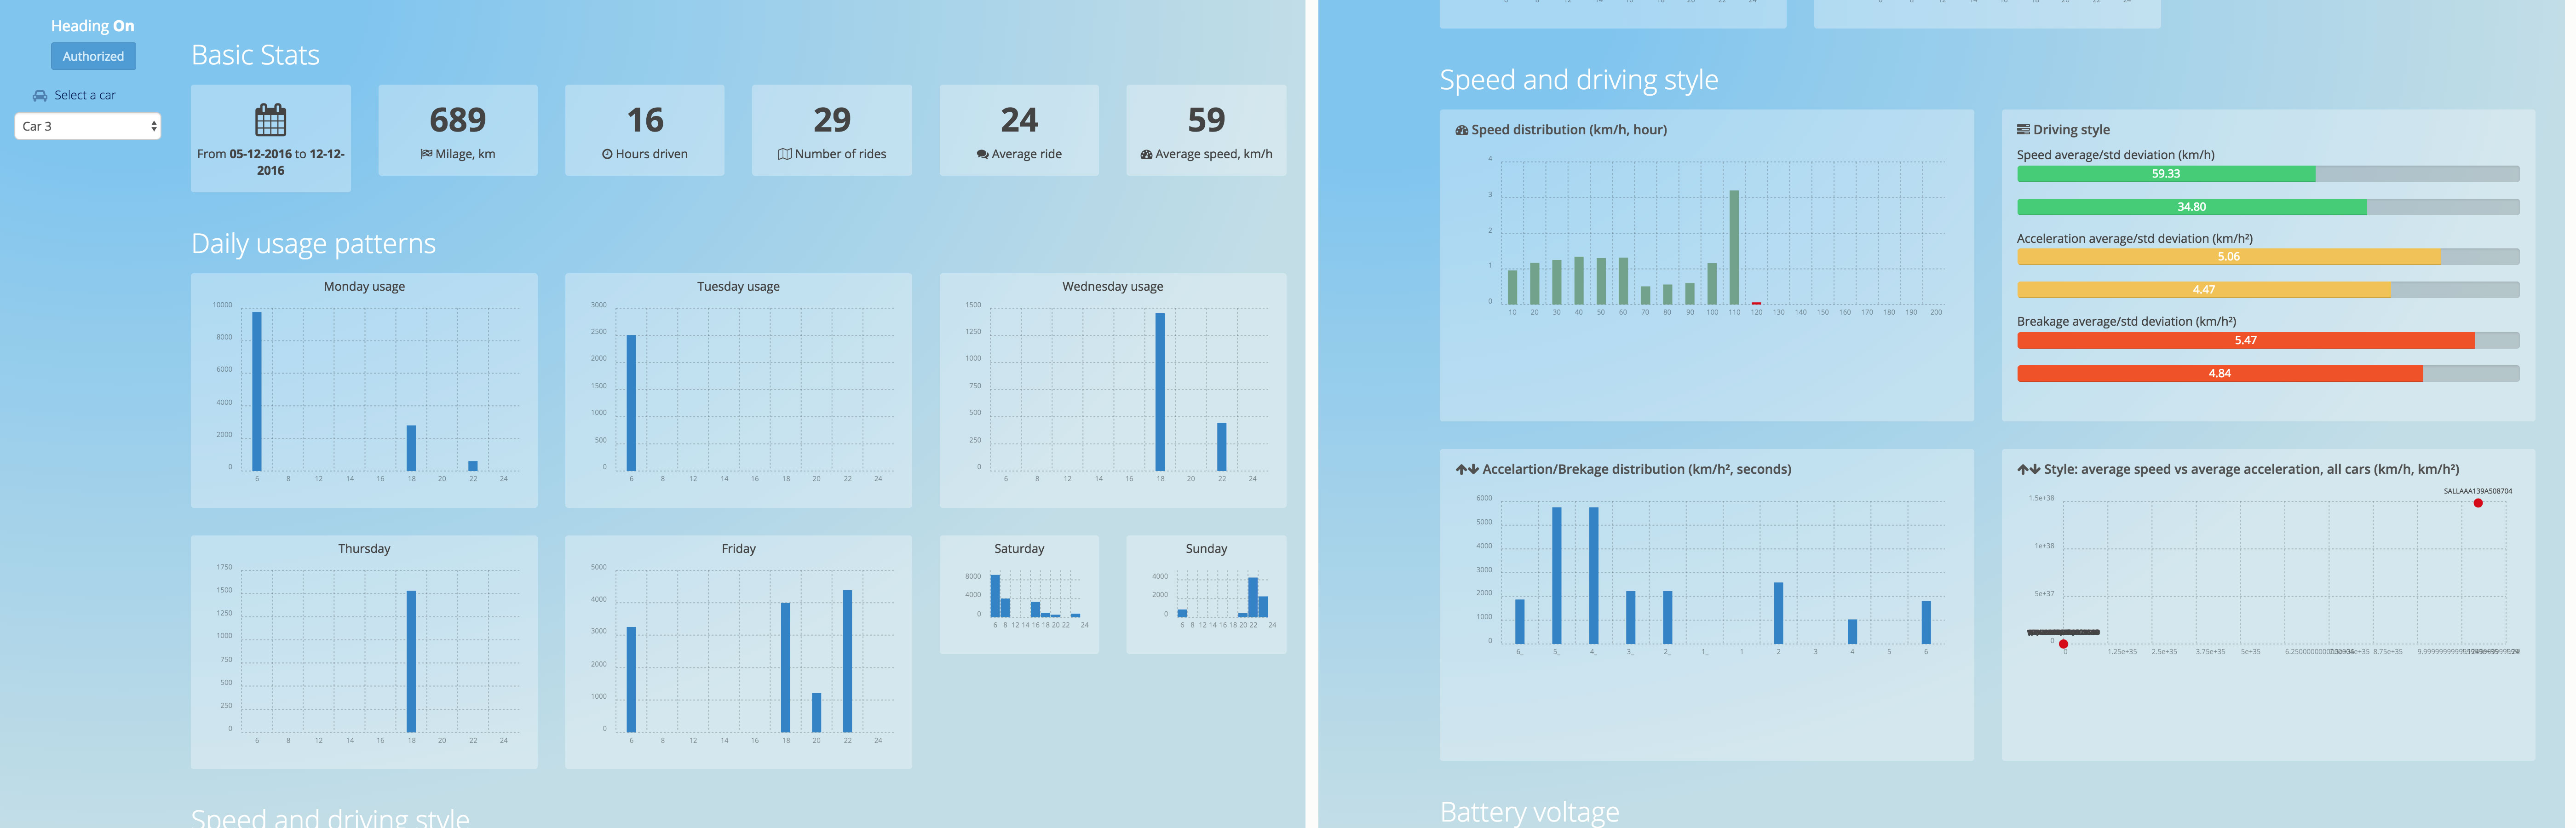
HEADING ON also created an internal dashboard to analyse the driver data as it came through.
This was another valuable resource in gaining insight into the test driver’s behaviours and vehicle usage patterns, some of which came as quite a surprise to the test drivers in realising that their own assumptions on their usage were quite different than what they stated in the market research.
We also collected very specific qualitative and quantitative data from the test drivers regarding their preferences, pain points and driving habits using surveys and questionnaires. These proved extremely insightful during the following phases of the project.
Exploratory Data Analysis
Exploratory Data Analysis
HEADING ON Internal Dashboard
RESULTS & FINDINGS
Based upon the results of our analysis, and the collected user data, we came to the below conclusions for the App and Service in general.
Main Vehicle Faults to Focus on
Rankings about the most common faults in vehicles vary depending on the source of information, however, there are three faults that always appear near the top:
- Battery/alternator/electrics
- Tyres
- Brakes
It is HEADING ON’s hypothesis that many occurrences of these faults can be predicted before they become severe enough for the vehicle to break down (or to fail at roadworthy tests).
There are two general categories of faults:
- Those that strike suddenly.
- Those where degradation builds up over time.
Both of these categories can be predicted granted you have access to the correct data.
Main Customer Objectives
For customers there are two main surprises we want to avoid:
- “Car breaks down or has a fault, and I didn’t see it coming.”
- “Substantial invoice from the garage – Why is it always so high? I feel ripped off.”
Also of importance to the users were the the desire to:
“never break down, save money, get a good deal on repairs, making it easy for customer to find reputable garage & swift repair, transparency & peace of mind, knowing what is happening (vs nightmare scenario – breakdown in the middle of the night, on the motorway, in the rain), knowing you are paying the correct amount for work done.”
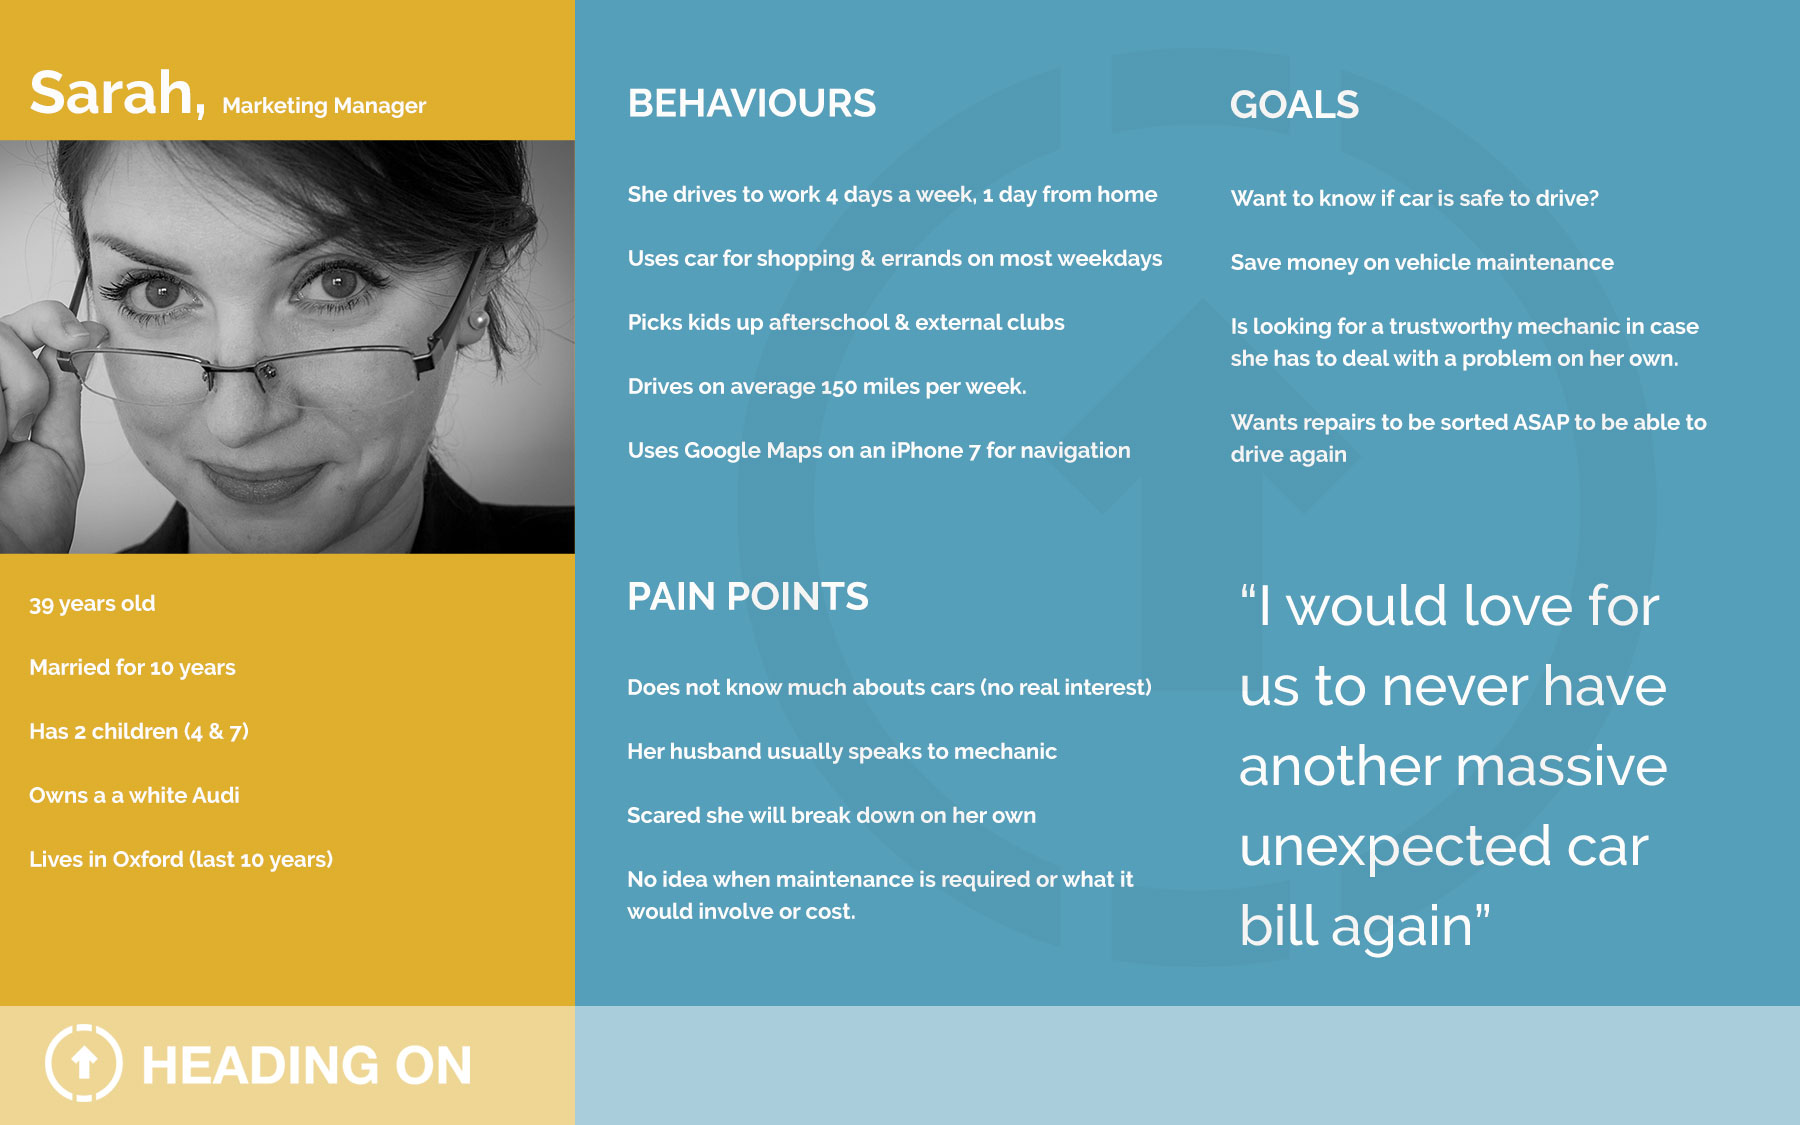
Based upon these results I set out and created a set of user personas to guide our UX and design process.
BASIC APP STRUCTURE & USER FLOW
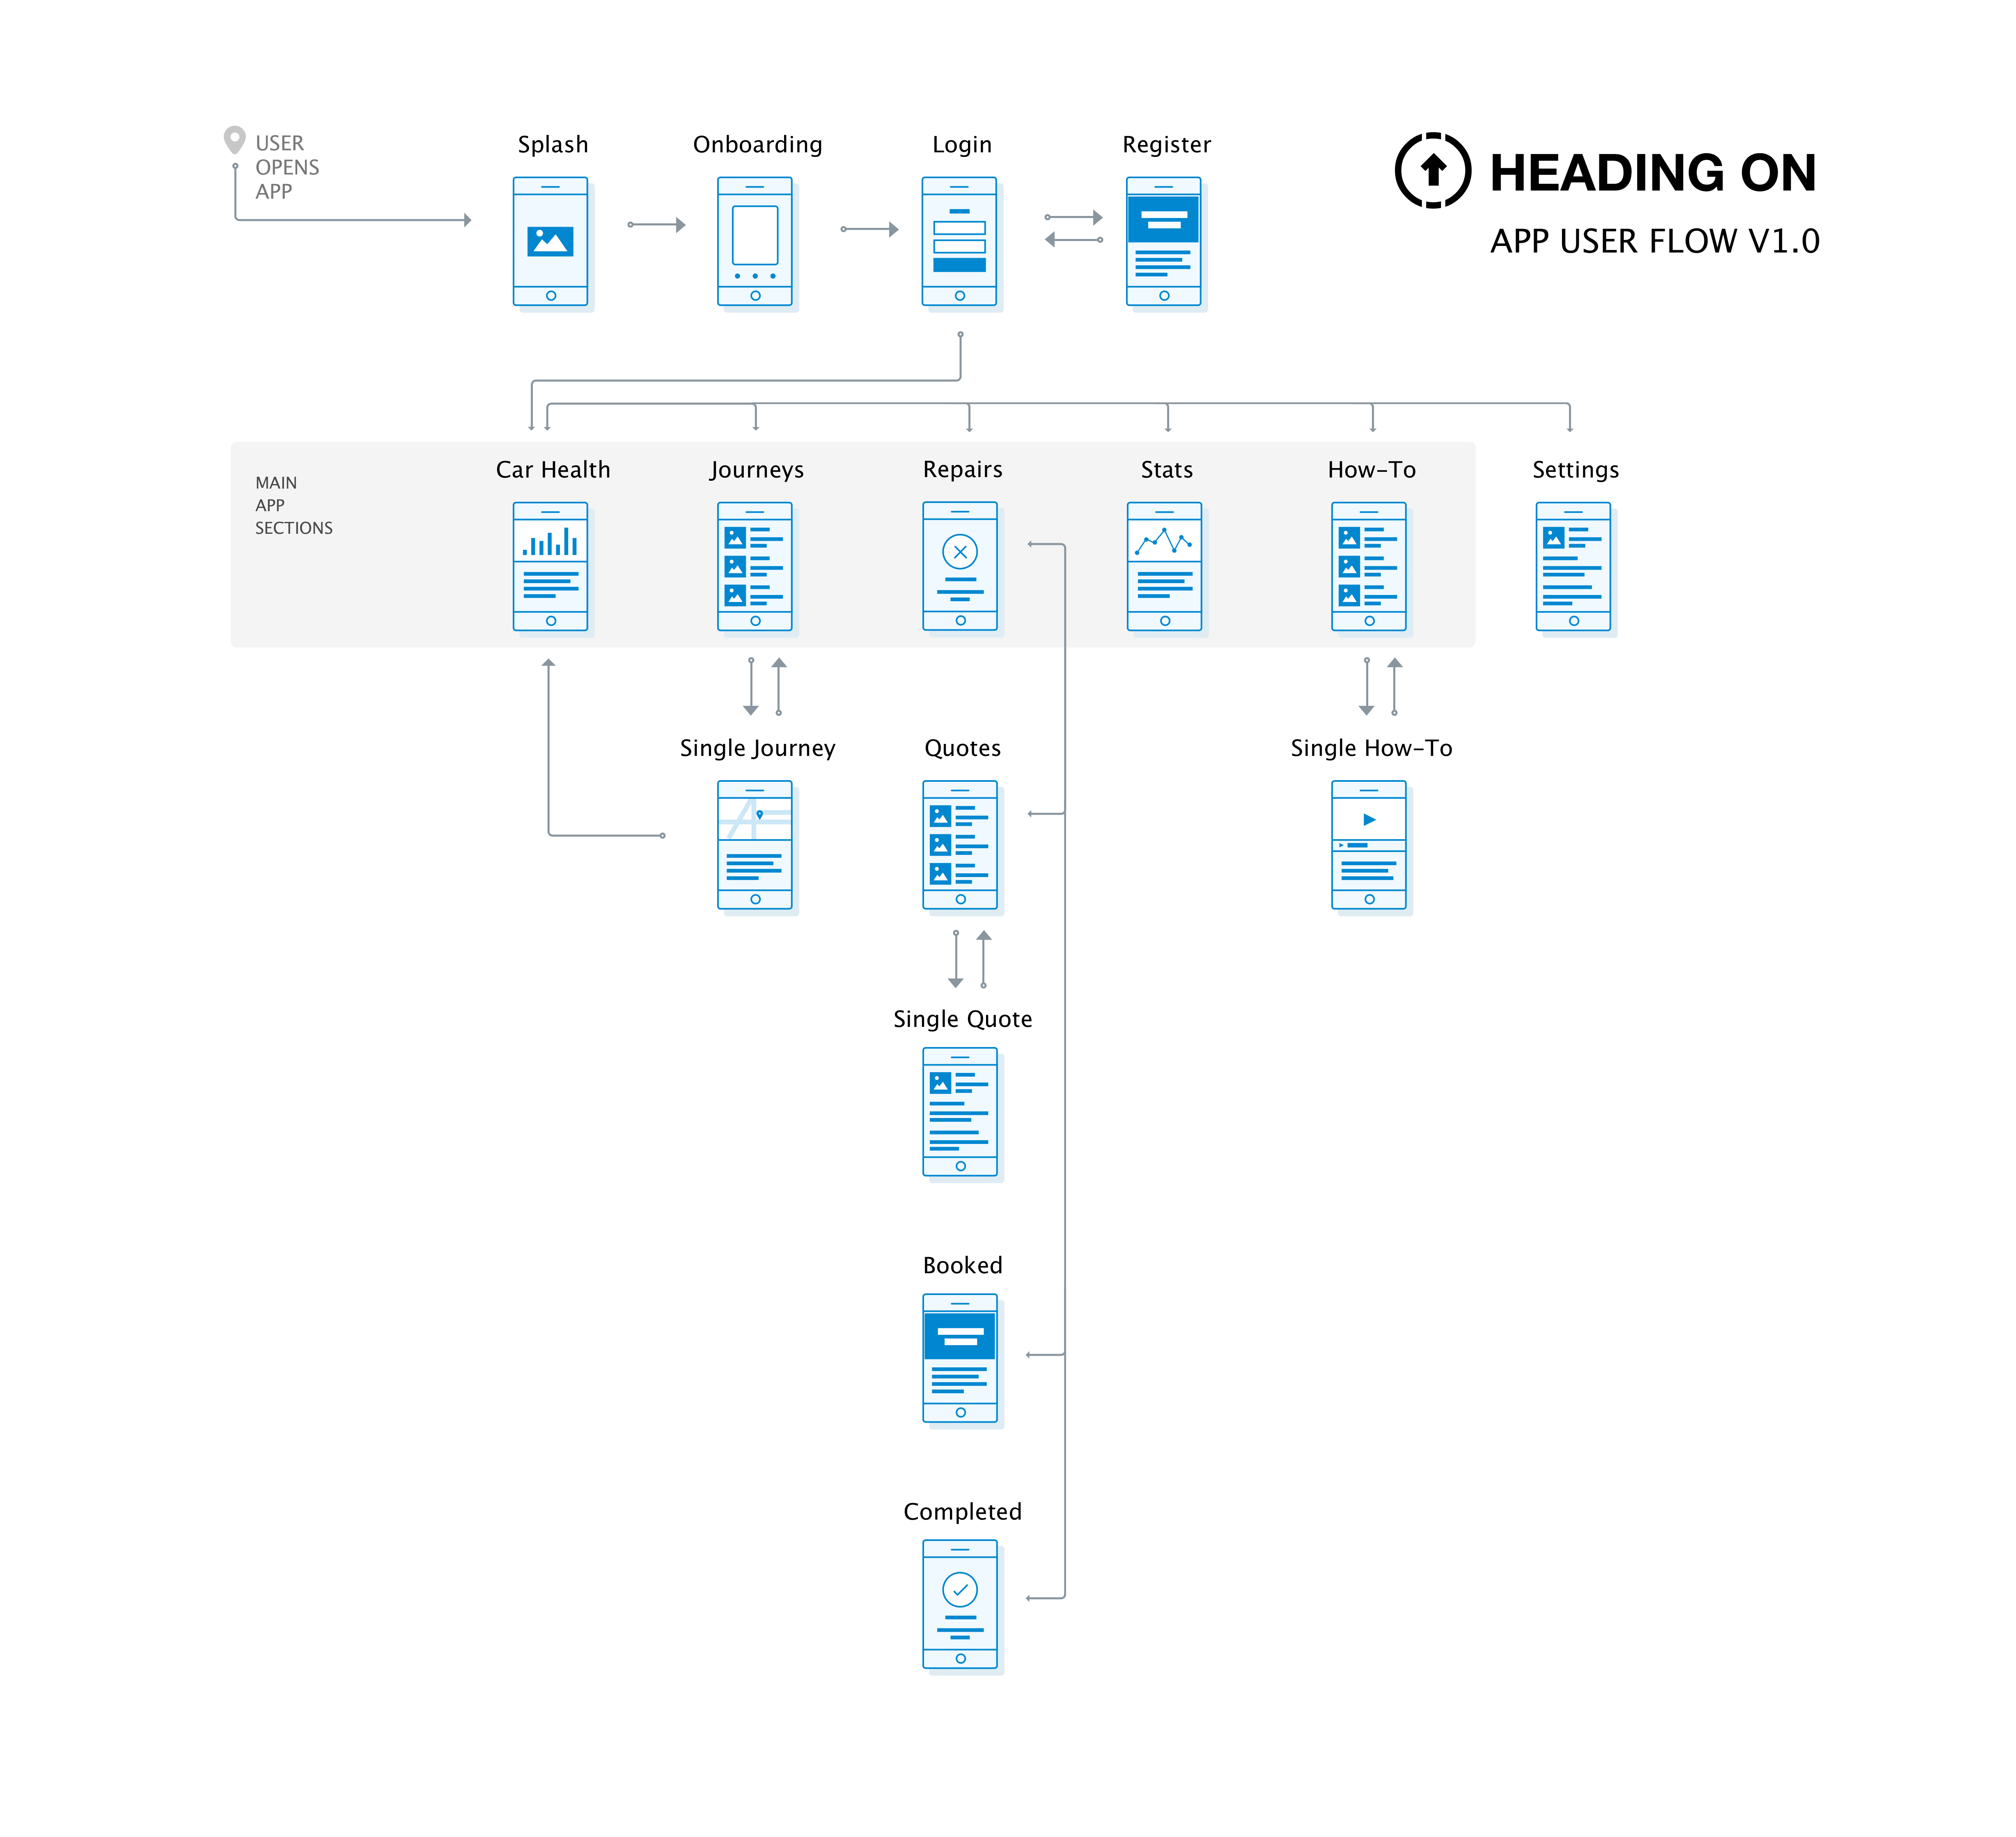
Next we spent time to scope out the intial structure of the App and which screen will best serve our user & business goals. This was then put together in the below.
SKETCHING & WIREFRAMING
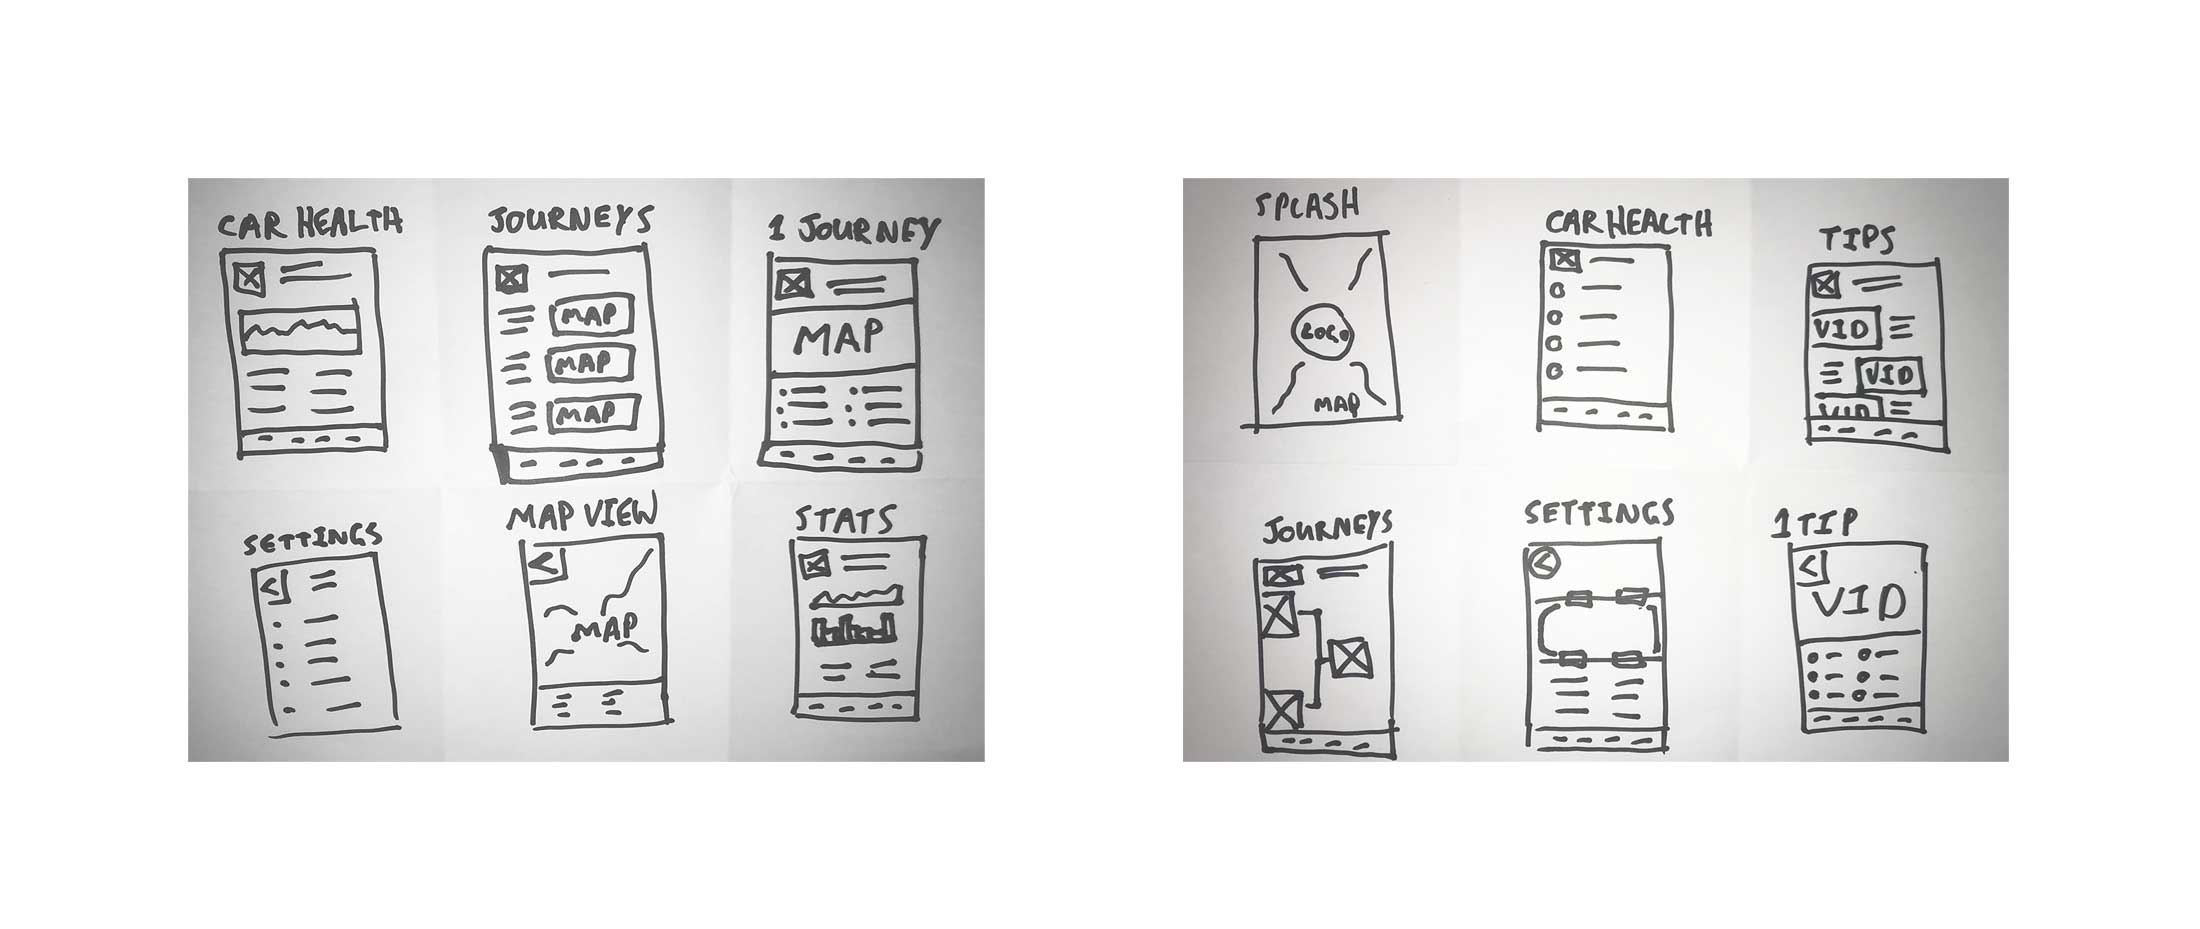
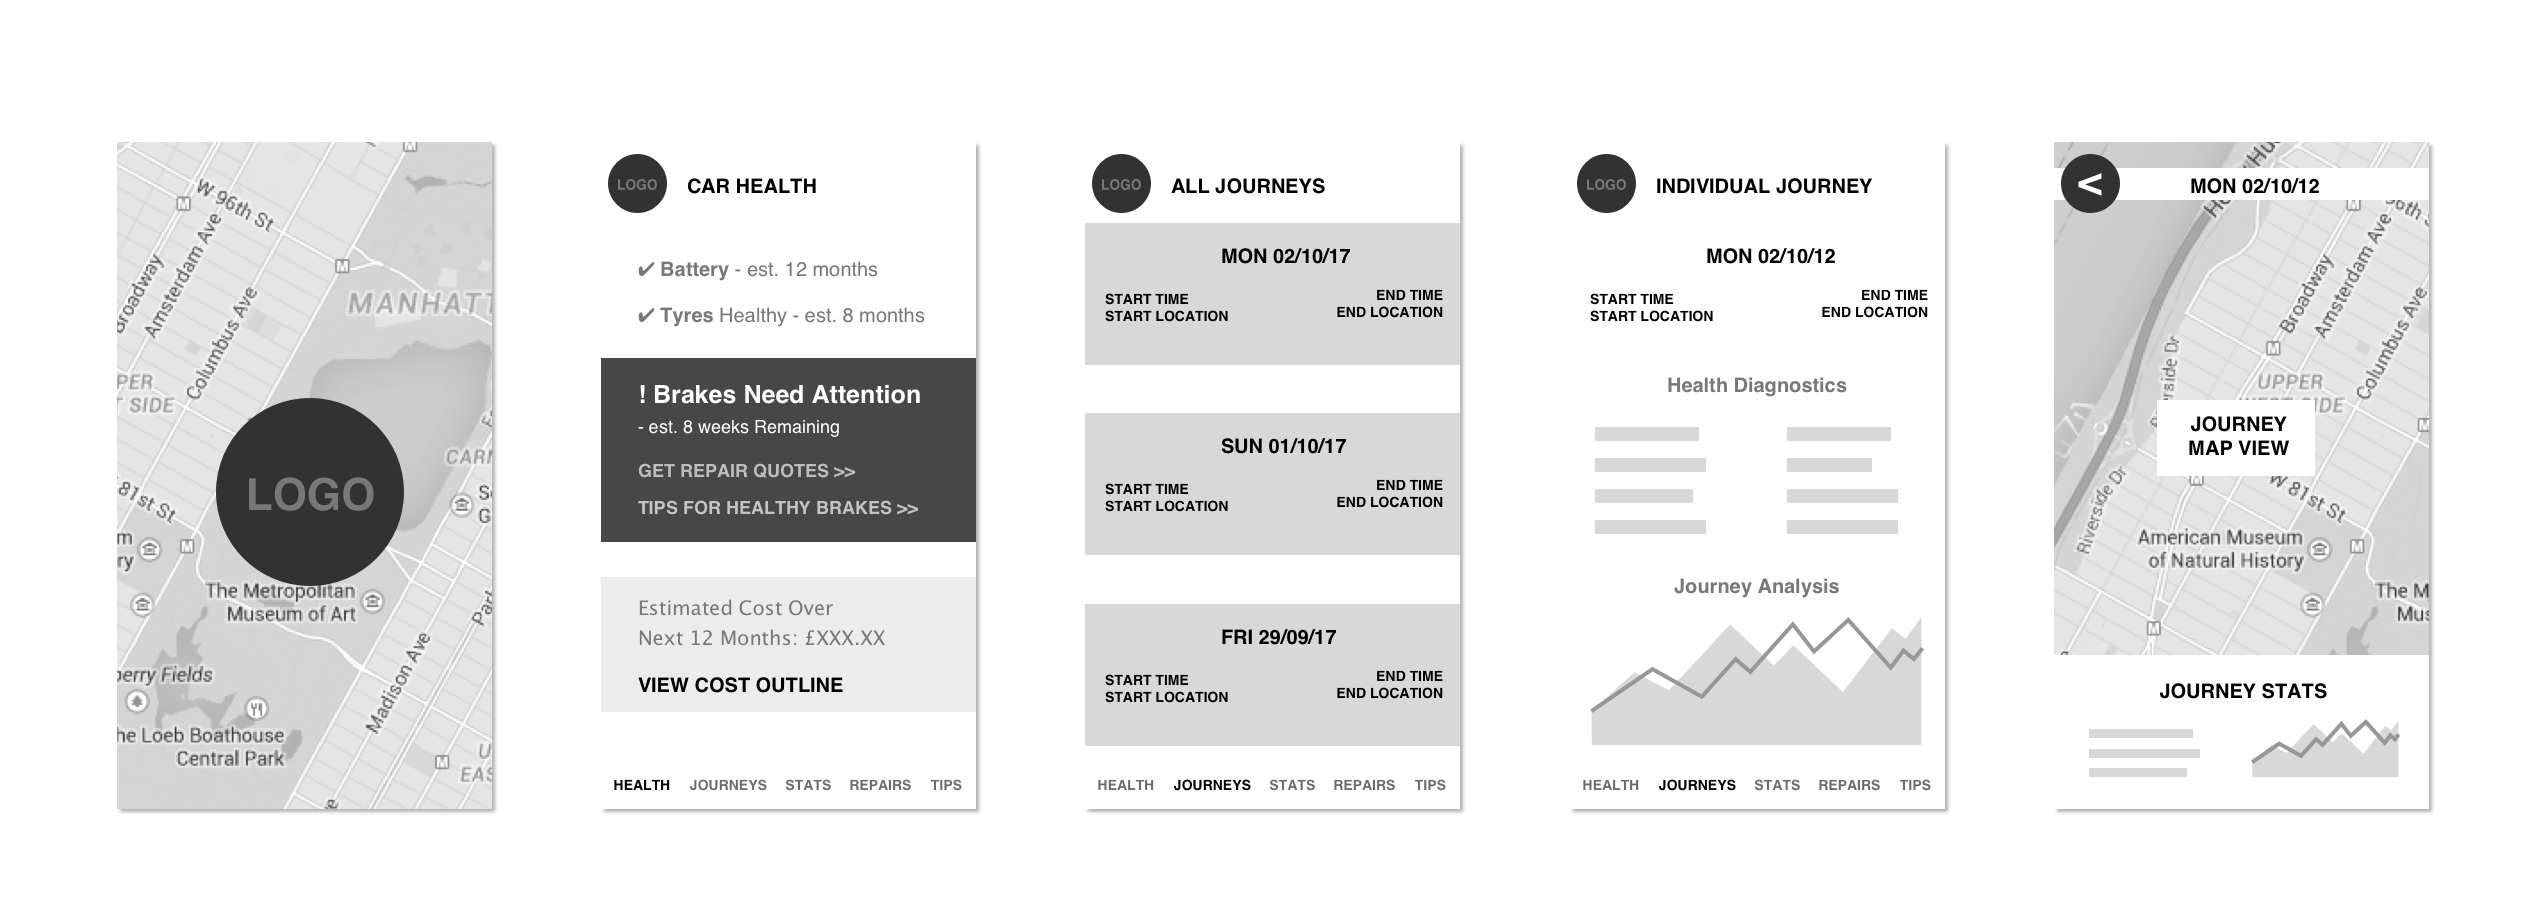
Armed with the above research and structure, I set out rapidly sketching possible screens. The idea here was to iterate as many ideas as quickly as possible. These ideas were then further developed into wireframes and again continuously improved upon based on the agreed user requirements and feedback.
HIGH FIDELITY DESIGNS
Once all the above steps were finalised it was time to design the final High Resolution Concepts. We still went back and forth, utilising our Persona’s, client research and also reviewing the wireframes to create the following solutions.